Console Guides
Analytics
Analytics is the project-scoped view of request volume, active users, storage, and error activity over a selected period. It draws on the same monitoring data as Monitoring, organized around a time period instead of a fixed dashboard.
Find it
Analytics is in the sidebar under the Operations group.
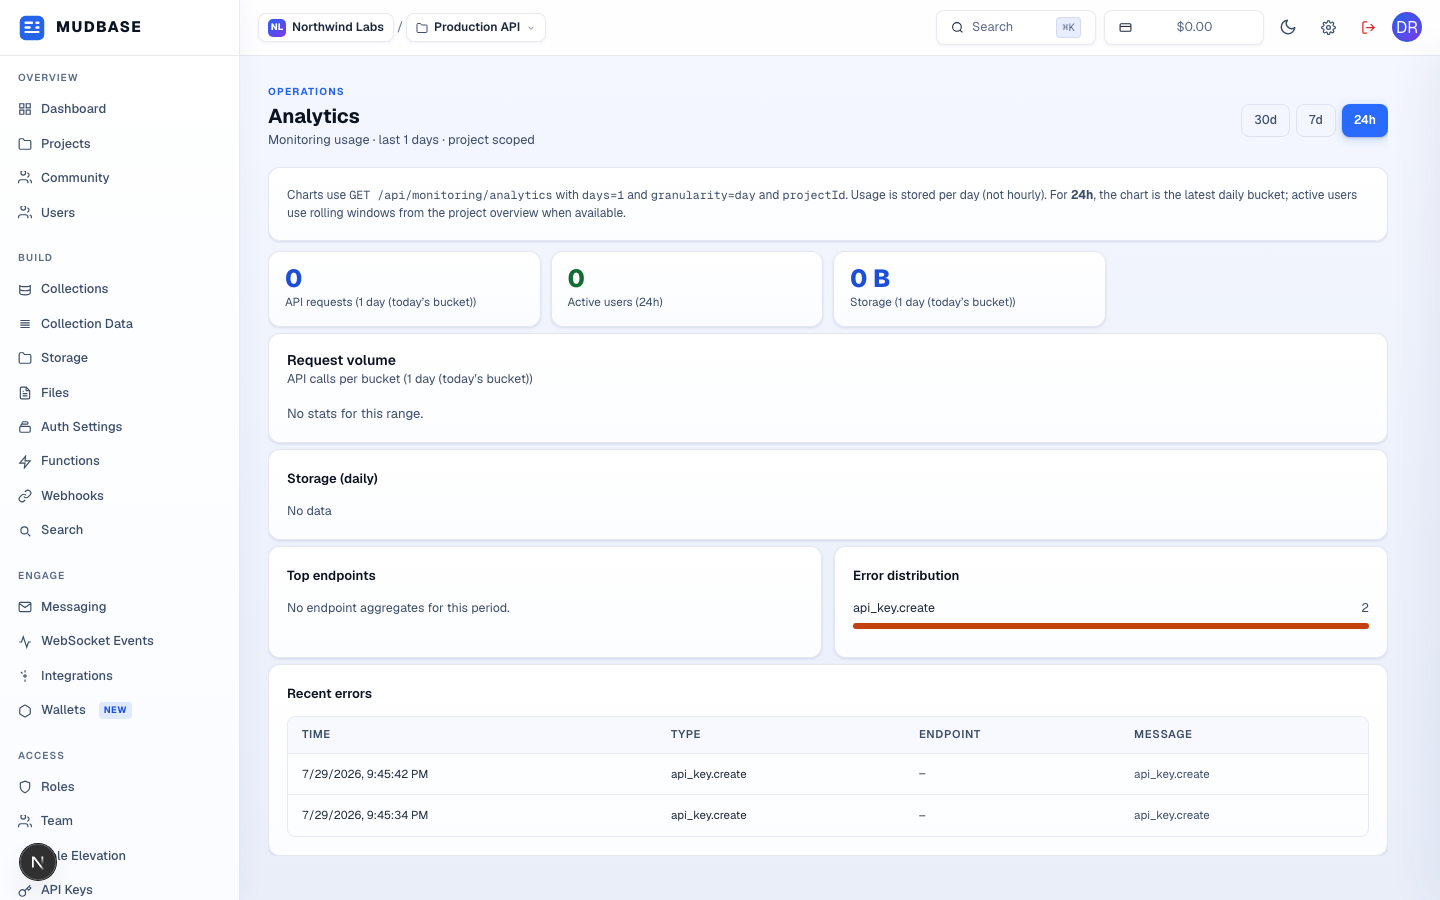
- Switches the query window. Usage is stored per calendar day, not hourly, so 24h shows today's daily bucket rather than a true rolling 24-hour window; active users under 24h do use a genuine rolling window when a project is selected.
- API requests and storage for the selected period, plus active users - active users only populate once you've selected a specific project in the header.
- API calls per bucket across the period. A quiet project or a very short window can legitimately show "No stats for this range" here.
- The endpoints that received the most calls this period - empty until enough request metadata has aggregated for the window.
- A bar per distinct error/event type recorded this period, sized relative to the largest count.
- The most recent individual error events - time, type, endpoint, and message - capped to the 8 most recent.
Note
A brand-new or low-traffic project will show mostly zeros and empty-state text here - that's the real, correct state, not a loading failure. Storage and request-volume charts populate once your project has a few days of real usage behind it.