Console Guides
Dashboard
The Dashboard is the first screen you land on after signing in - a snapshot of the current project's traffic, plus one-click shortcuts to the things you'll set up first.
Find it
Dashboard is the top item in the left sidebar, under the Overview group. It's where the console opens by default every time you sign in.
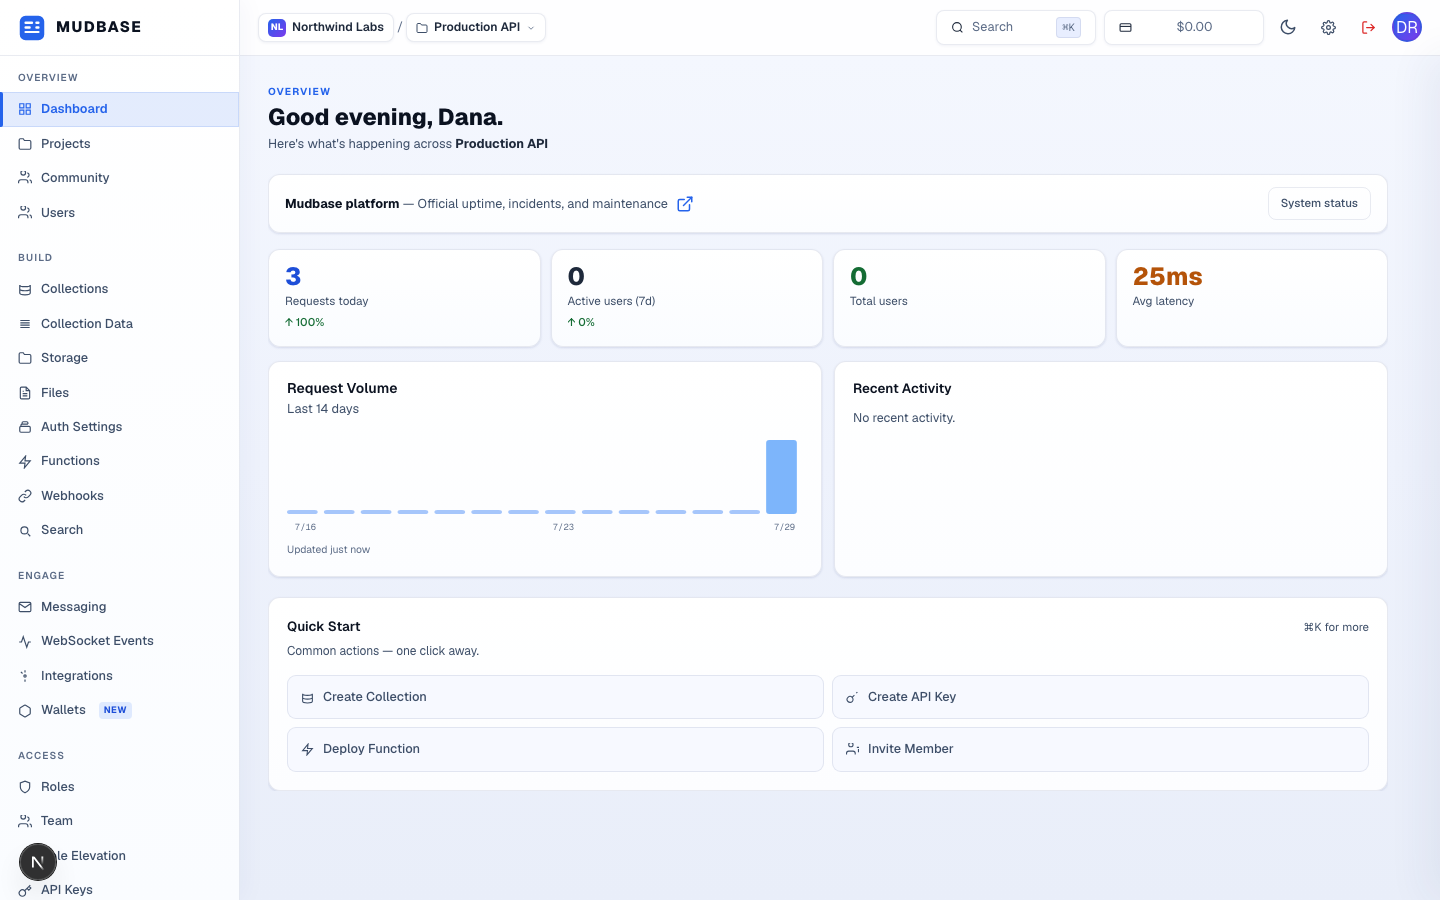
- Click Dashboard in the sidebar any time to come back here.
- Use the switcher at the top to change which organization and project the whole console is scoped to - every page below reflects whichever project is selected here.
- The Quick Start panel only appears while a project is new - it links straight to the four things most people set up first: a collection, an API key, a function, and a team invite.
What the numbers mean
The four stat cards (Requests today, Active users (7d), Total users, Avg latency) and the Request Volume chart below them are read-only - they update automatically as your project receives real API traffic. A brand-new project shows zeros until its first request comes in.
Recent Activity
The Recent Activity card on the right lists the latest actions taken in this project - collections created, keys issued, deployments - newest first. Use it to confirm an action (like the ones in this guide series) actually went through.