Console Guides
Monitoring
Monitoring is the operational health view for your project: a usage snapshot, request performance, an audit log of account and infrastructure actions, and threshold-based alerts - across four tabs.
Find it
Monitoring is in the sidebar under the Operations group.
Overview
The Overview tab opens on four tab buttons (Overview, Audit Logs, Errors, Alerts) and a Refresh control that re-fetches every source on the tab you are currently viewing.
Three stat cards sit below them: success rate and avg response time, both derived from request performance data over the selected window, and active alerts, which counts alerts with isActive true.
Beneath the cards, the usage and performance panel shows API calls and storage for the selected window, followed by request counts, error counts and a daily breakdown.
Audit Logs
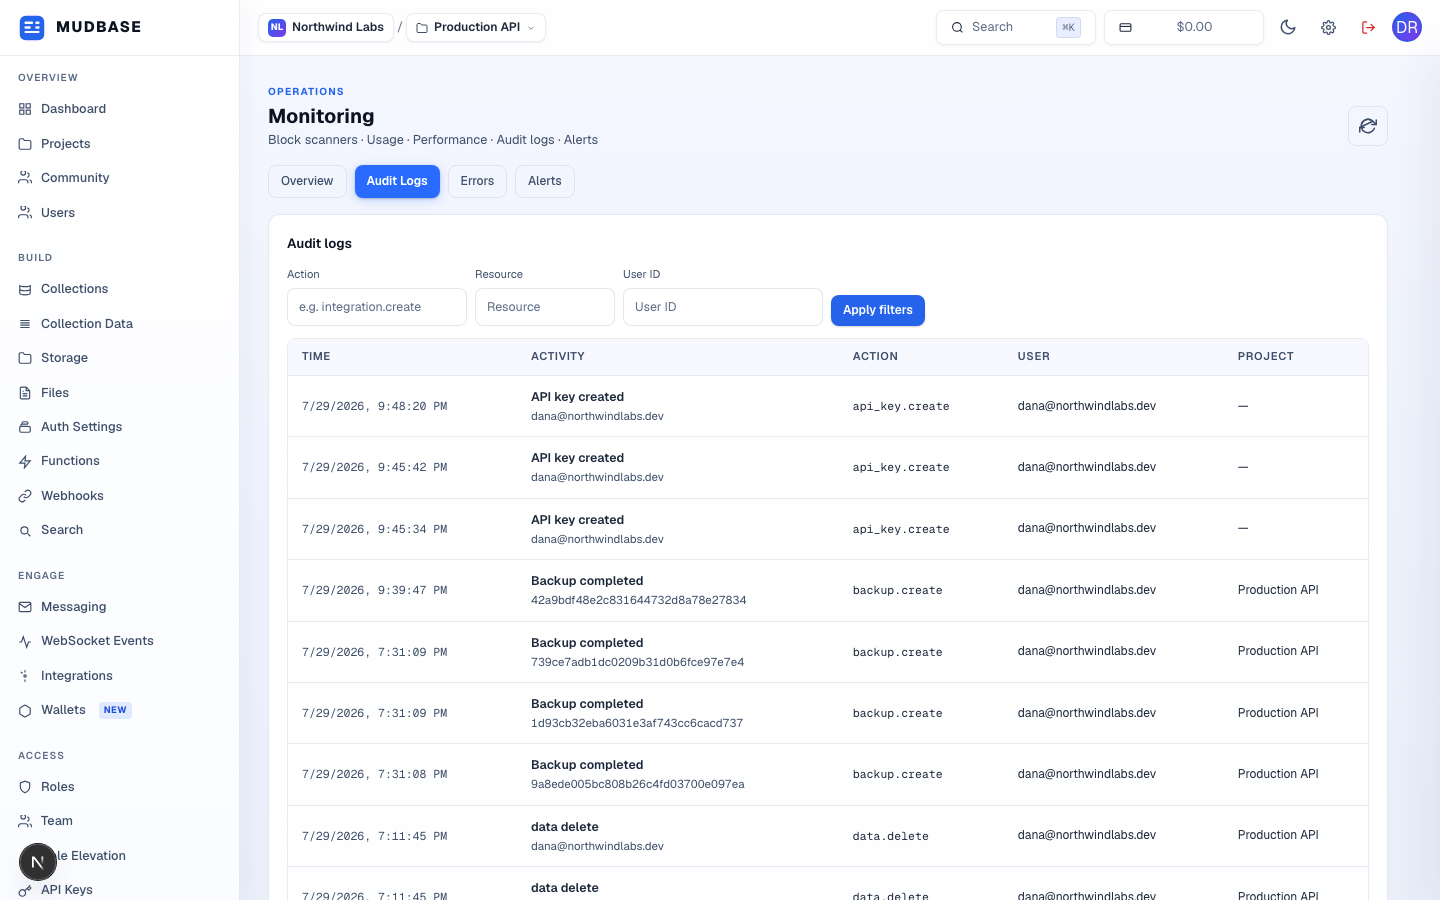
- Narrow by Action (e.g.
backup.create,api_key.create), Resource, or a specific User ID. - Click to apply the filters above; clearing the fields and applying again resets to page 1.
- Each row shows when an event happened, a human-readable activity title and detail, the machine action string, which user triggered it, and which project it belongs to. Actions like
backup.createanddata.deleteland here automatically - you don't configure what gets logged.
Errors
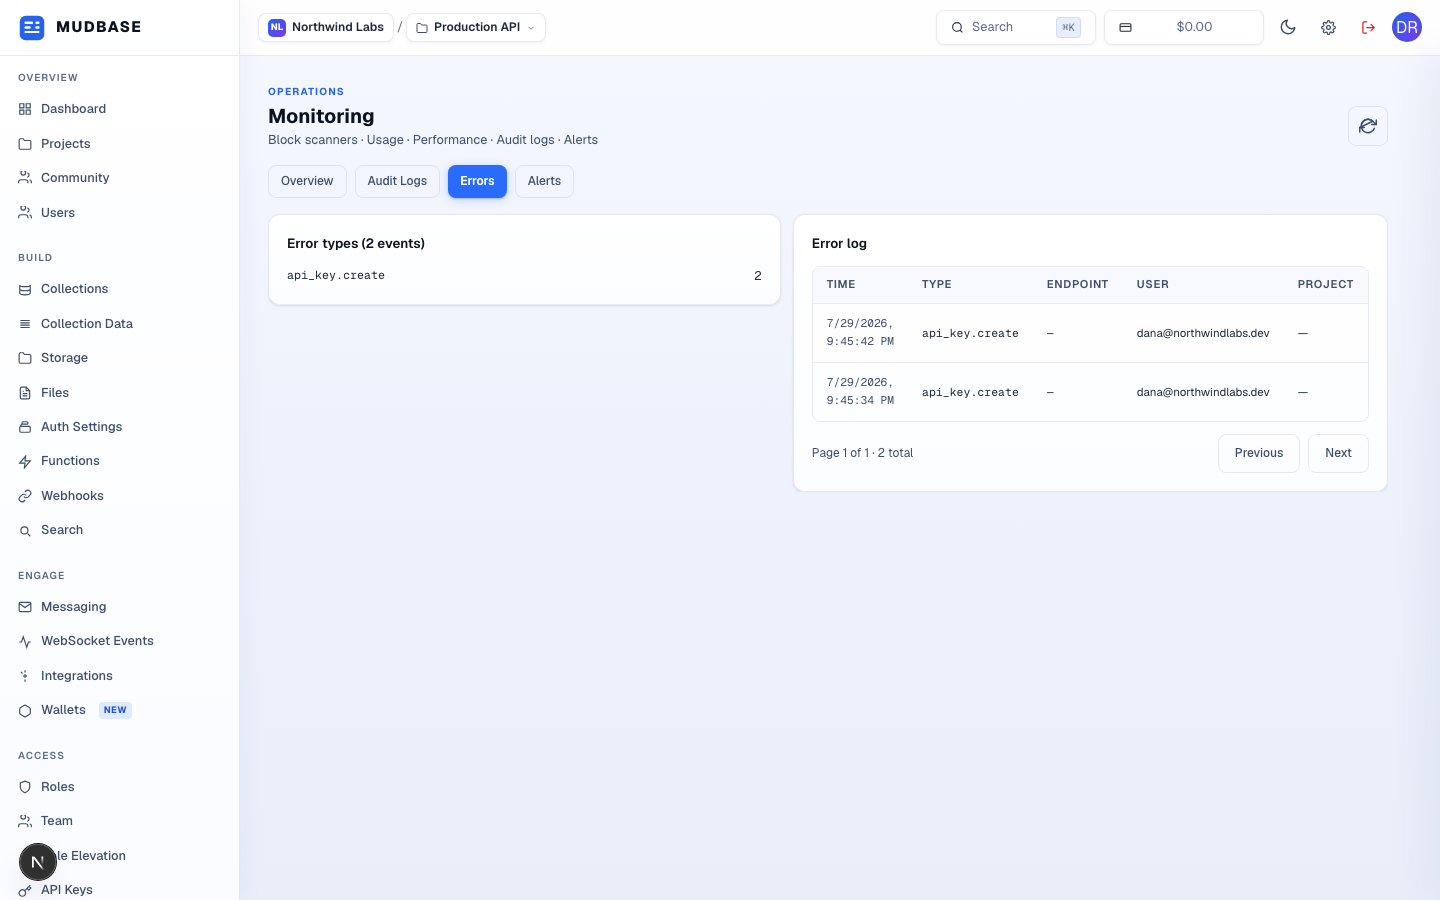
- A count per distinct error/event type recorded for this project, most useful for spotting one type spiking.
- The same events as a paginated table - time, type, endpoint (when recorded), user, and project. A quiet project can legitimately show no rows here.
Alerts
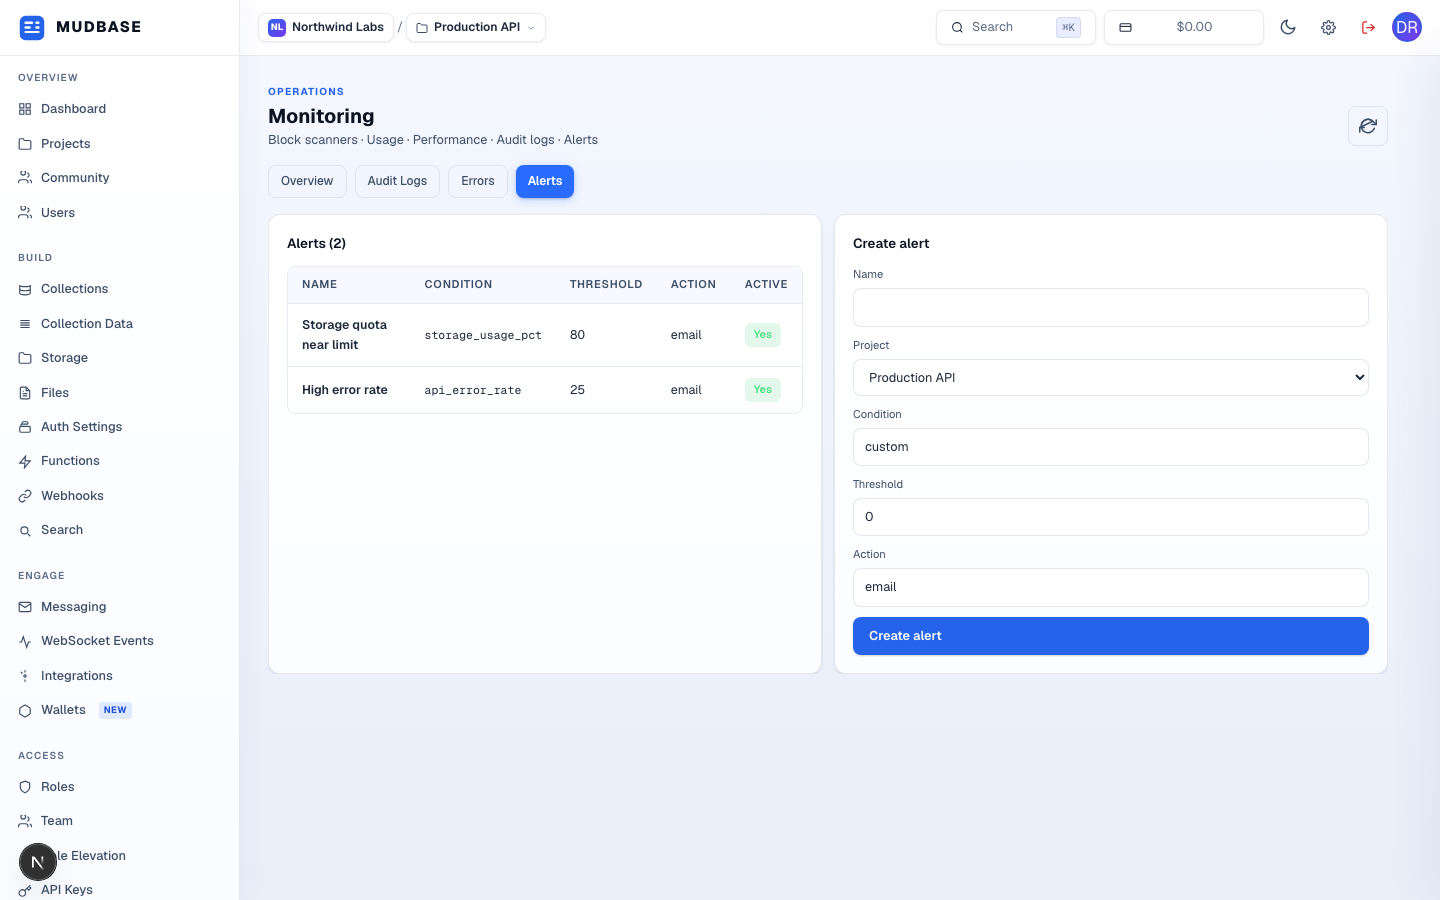
- Name, condition, threshold, notification action, and whether the alert is active. Conditions and thresholds are free text/number - there's no fixed enum, so name them descriptively (e.g.
api_error_rateat threshold25). - Pick the project the alert applies to, set a condition, threshold, and action (e.g.
email), then click Create alert. Alert count per project is capped by your plan - the form disables with a limit message once you're at capacity.